
When a player opens a slot’s help screen and sees “RTP: 96.5%,” they’re reading a number that tells them almost nothing useful about what will happen to their bankroll in the next two hours. RTP — Return to Player — is a theoretical long-run average, calculated across billions of simulated spins, that describes where the math eventually settles. It does not describe the path.
The path is determined by the engine.
There are two fundamentally different slot engine architectures dominating the modern online casino landscape: the traditional payline engine and the cluster-pay (tumble/cascade) engine. On the surface, both can display the same RTP. Underneath, they are structurally different machines with different probability distributions, different EV curves, and different implications for how a bankroll behaves over a real session.
The shift from fixed payline grids to cluster-pay mechanics isn’t cosmetic. It isn’t a design trend. It is a structural redesign of how wins are generated, how they compound, and — critically — where in the probability distribution the bulk of the game’s value is stored.
Understanding which engine you’re playing isn’t optional context. It’s step one in predicting variance behavior. Everything else — session length, stake sizing, stop-loss calibration — follows from it. This engagement often extends beyond gaming itself, as audiences explore different digital environments and platforms such as (Arabic: تسجيل دخول ميلبيت), reflecting a broader interaction with interactive systems and entertainment technologies.
Payline Math vs. Cluster Combinatorics
The Linear Architecture of Payline Engines
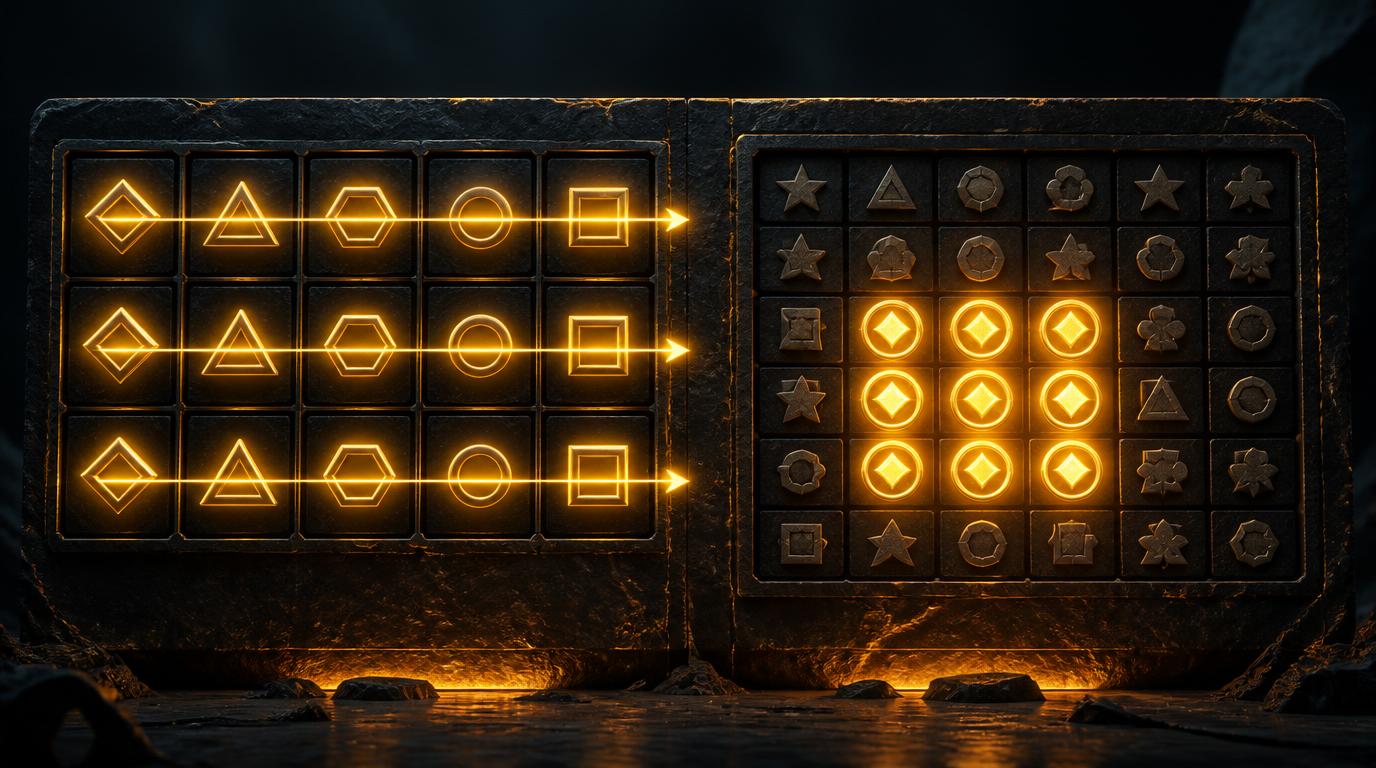
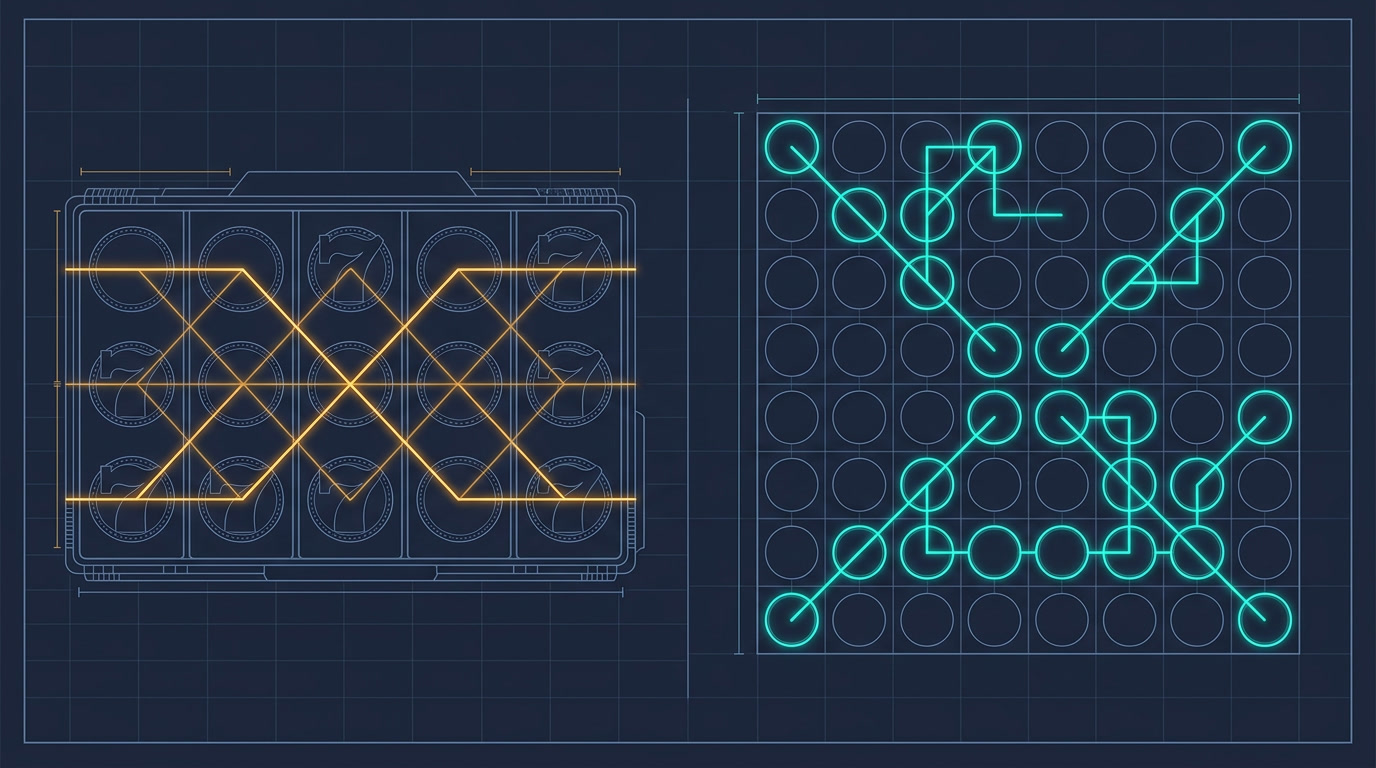
A standard payline slot operates on a deterministic win-path structure. The grid — typically 5 reels by 3 rows, producing 15 symbol positions — is evaluated against a fixed set of lines, usually reading left to right from reel 1. Whether the game has 10 paylines or uses the “243 ways” model (where any matching symbol on adjacent reels constitutes a win regardless of row position), the fundamental logic is the same: wins are evaluated along pre-defined paths.
This linearity is the defining mathematical property of the payline engine. The number of possible win combinations on any given spin is bounded and calculable. Each reel contains a symbol strip — a weighted sequence of symbols that the RNG maps to via index selection. The probability of any specific symbol appearing on a given reel at a given row position is fixed and transparent. A studio can precisely engineer the hit frequency (the percentage of spins returning any win) by adjusting reel strip weights.
Typical payline hit frequencies fall between 22% and 35% for medium-volatility configurations. Each winning spin delivers a payout calculable as:
Win = Symbol multiplier × Stake per line × Number of matching lines triggered
The relationship between input (spin) and output (win) is linear. A high-symbol combination on three lines pays three times what it pays on one line. There is no compounding mechanism within a single spin event. The variance of the game is therefore primarily a function of the paytable structure — specifically, the ratio between high-symbol multiplier values and low-symbol multiplier values, and how frequently each tier lands given its reel strip weight.
The Exponential Complexity of Cluster Combinatorics
Cluster-pay engines break every assumption above.
A cluster engine evaluates wins not by line paths but by connected groups of identical symbols within the grid. A cluster win requires a minimum number of adjacent matching symbols — typically 5 to 8, depending on the studio’s math model — touching horizontally or vertically. The grid is larger: commonly 6×6, 7×7, or 8×8, producing 36 to 64 symbol positions.
The combinatorial space is not linear. It is exponential. On an 8×8 grid with 6 symbol types, the number of possible symbol arrangements runs into the billions. More importantly, whether a cluster forms is dependent on the spatial relationship between symbols — not just their individual probability of appearing. A symbol with a 1-in-8 landing probability on any given cell contributes to a cluster win only when it appears adjacent to at least 4 other identical symbols. The probability of that spatial configuration occurring is a product of multiple weighted probabilities interacting simultaneously.
This creates a structural outcome that surprises many players: cluster engines often have higher raw hit frequencies than payline engines — surface numbers of 35% to 55% of spins returning some win — but a disproportionately large share of those wins are sub-stake returns. Dead spins, in practical terms. Spins where the engine registers a win but returns 0.2× to 0.6× of the player’s bet, resulting in a net loss.
Why does this happen? Because to offset the mathematical probability of small clusters forming frequently, studios assign very low per-symbol multiplier values to the smaller cluster tiers. A 5-symbol cluster of a mid-value symbol might pay 0.1× to 0.3× stake. The engine hits frequently, but it hits small. The high-value output is concentrated elsewhere — in the cascade. Platforms like MelBet Instagram Mauritania have games of both types.
Mathematician’s Note: The “dead spin” effect in cluster engines is not a bug or a player’s bad luck. It is a deliberate math model outcome. If small clusters paid proportionally, the overall RTP would exceed 100% in any session with moderate hit frequency. The low per-symbol values are the mathematical counterweight to the high spatial probability of small cluster formation. The engine is designed to feel active while reserving its value mass for rare, deep-cascade events.
The Non-Linear EV Spike — Cascades and Multipliers
The Avalanche Mechanic Defined
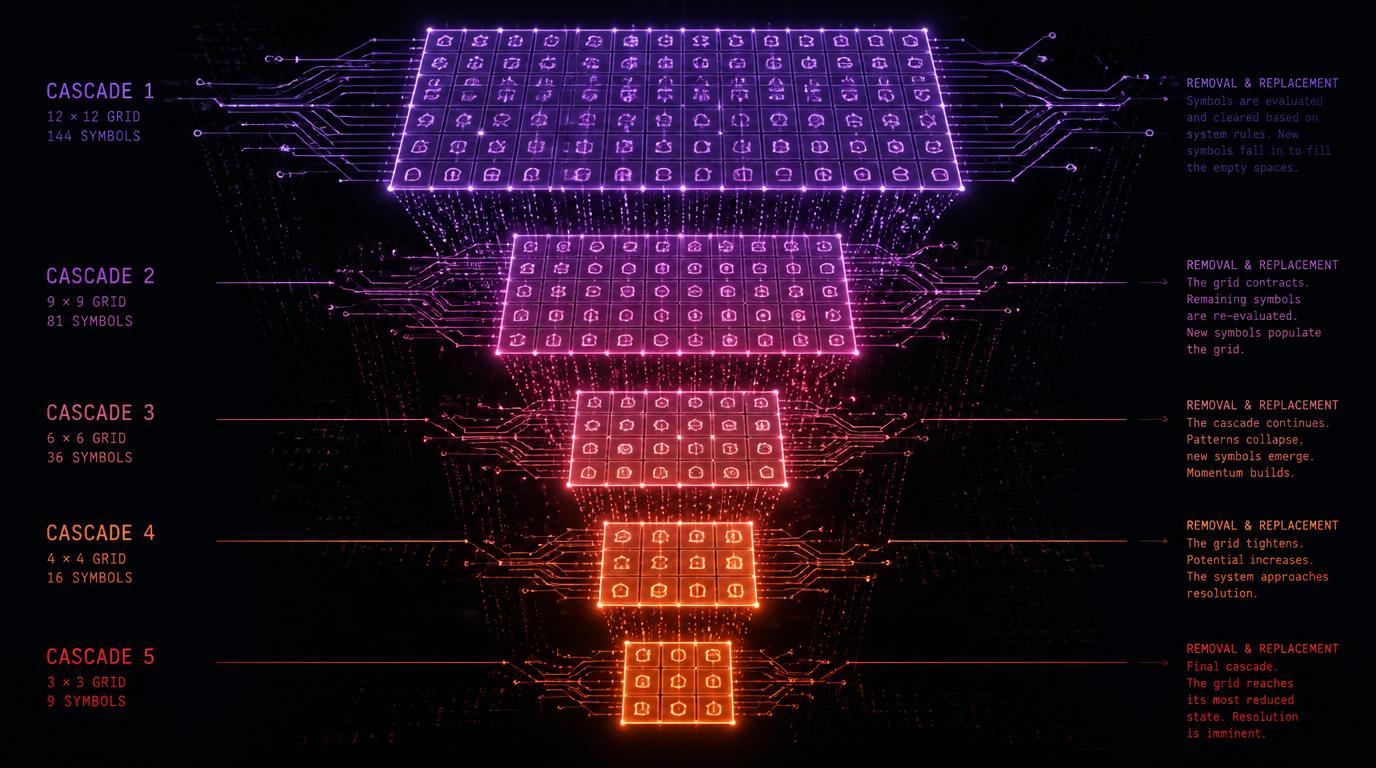
When a cluster win is registered, the winning symbols are removed from the grid. New symbols fall from above (or from the sides, depending on the studio’s orientation) to fill the vacated positions. If the new symbol arrangement creates another qualifying cluster, a second win is registered. This process repeats until no new qualifying cluster forms. This sequence — initial spin → win → removal → replacement → evaluation → repeat — is the cascade, also called the avalanche or tumble mechanic.
The cascade is not a bonus. It is a core part of the engine’s base math. Every spin in a cluster-pay game has the potential to cascade indefinitely, and the cumulative value of a cascading spin is the sum of all wins across all cascade levels within that single spin event.
Concentrated Variance: The Mathematics of Cascade Gating
Here is the central mathematical insight of the cluster-pay engine: the probability of reaching cascade level N is the joint probability of winning cascades 1 through N minus 1. Each cascade is a dependent sub-event. The engine doesn’t reset after each cascade — it continues from the state left by the previous removal and replacement. This dependency structure creates exponential difficulty in accessing high-multiplier territory.
Approximate probabilities for a typical high-volatility cluster engine:
- Cascade 1 (any win on initial spin): ~42–48% of all spins
- Cascade 2 (win follows first cascade): ~18–22% of all spins
- Cascade 3: ~8–10% of all spins
- Cascade 4: ~3–5% of all spins
- Cascade 5 or deeper: ~1.5–2.5% of all spins
The cascade multiplier mechanic — where an additional multiplier is applied to each subsequent cascade level — is typically engineered to activate at cascade 3 or cascade 4. At cascade 5 and beyond, compounding multipliers of 3× to 10× or higher are applied to already-outsized symbol win values.
The result is that the engine’s maximum win potential is mathematically gated behind a sequential chain of improbable events. Approximately 1.5–2% of spins reach the cascade depth where the max-win territory becomes accessible. But those 2% of spins may carry 35% to 45% of the engine’s total EV mass.
This is concentrated variance, and it is the defining feature of the cluster-pay architecture. The distribution of outcomes is not bell-curved around a mean. It is heavily right-skewed, with the vast majority of spins producing sub-stake or small wins, and a small but mathematically meaningful tail of extremely high-value events that pull the RTP calculation to its theoretical ceiling.
The practical consequence: in a 200-spin session, a player may never reach cascade level 4. Their experienced RTP will be 10 to 20 percentage points below the declared theoretical RTP — not because the game is cheating, but because they have not sampled the high-value tail of the distribution. The math is working exactly as designed.
Fresh Spin vs. Tumble Replacement
How the RNG Handles Symbol Replacement
In a standard payline engine, each spin is a statistically independent event. The RNG generates a seed value, maps it to a position on each reel’s symbol strip, and the resulting grid state has no memory of the previous spin. Every reel position is determined by a fresh, independent RNG output. Symbol weighting is encoded in the strip itself — a symbol appearing 5 times on a 50-position strip has a 10% probability of landing on any given reel position.
In a cluster-pay tumble engine, replacement symbols are not generated by an entirely fresh spin event. When winning symbols are removed and new symbols fall to replace them, the RNG generates values for the replacement positions only. The surviving symbols from the previous grid state — those that did not form part of a winning cluster — remain in place. Their positions are carried forward.
This is a fundamentally different probabilistic model. The post-cascade grid is a hybrid state: partially inherited from the previous cascade result, partially freshly generated. The inherited symbols are not re-weighted or re-rolled. They retain whatever symbol identity they had on the previous cascade, and their spatial relationship to the newly generated replacement symbols determines whether a new cluster forms.
Weighted Probability and Grid-State Dependency
The implication for symbol weighting is significant. In a payline engine, the probability of any specific symbol appearing at any position can be stated as a static number — it is determined entirely by the symbol’s frequency on the relevant reel strip. In a cluster engine, the probability of a cluster forming at cascade level 2 depends on:
- The probability distribution of replacement symbols generated by the RNG for vacant positions
- The specific symbol identities of surviving symbols adjacent to the vacant positions
- The spatial layout of the inherited grid state
Points 2 and 3 are not determined by static symbol strip weights. They are determined by the outcome of cascade level 1, which was itself determined by the outcome of the initial spin. The cascade chain creates a path-dependent probability structure. The effective probability of a cascade-3 win is conditional on the cascade-2 grid state, which is conditional on the cascade-1 grid state.
This path dependency is why cluster engines are computationally expensive to model and why RNG certification for tumble engines requires significantly more simulation volume than standard payline engines — the state space is exponentially larger.
Mathematician’s Note: When reviewing certified RTP documentation for cluster-pay games, look for the simulation volume disclosed. A well-modeled cluster engine requires 500 million to 1 billion simulated spins to produce statistically stable RTP results. Payline engines typically certify at 100–200 million spins. If a cluster engine’s certification cites fewer than 300 million simulations, the theoretical RTP figure carries wider confidence intervals than the declared number implies.
Grid Size and Volatility Signaling
What the Grid Tells You Before You Read the Help File
Grid architecture is the most reliable visual signal of a slot’s volatility tier — more reliable than the developer’s declared volatility label, which is often understated for commercial reasons. The relationship between grid dimensions and volatility is not arbitrary. It is a direct consequence of the combinatorial mechanics described above.
5×3 grid (15 cells): The standard payline configuration. Volatility tier is determined primarily by the paytable structure. Low to high volatility is achievable within this grid. The grid itself does not constrain the volatility; the reel strip weights and symbol multiplier ratios do.
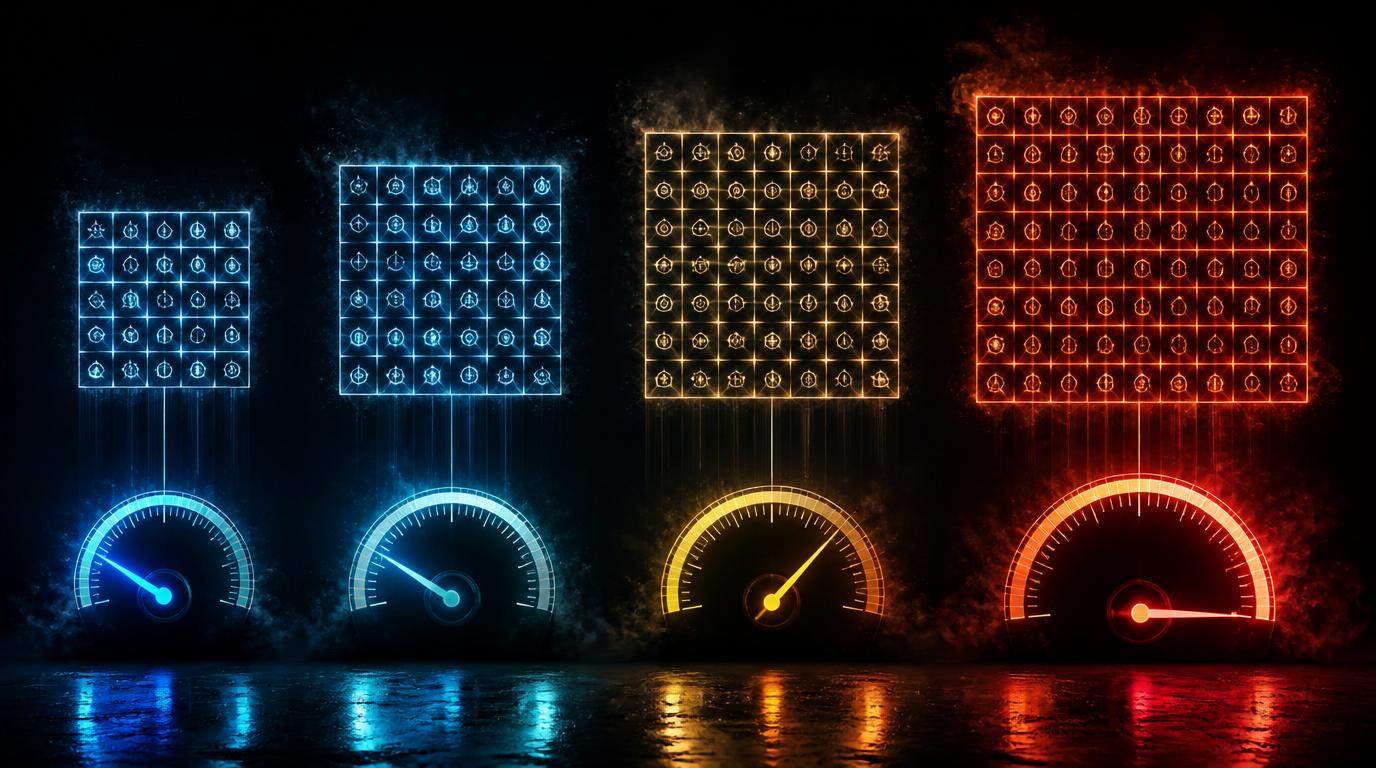
5×5 or 6×5 grid (25–30 cells): Transitional configurations, sometimes used in payline games with added mechanics. Cluster pays on this grid size tend toward medium to high volatility because the larger grid increases the probability of mid-size clusters while still limiting deep-cascade frequency.
6×6 grid (36 cells): The entry point for dedicated cluster engines. High volatility is the baseline. The combinatorial space is large enough to support meaningful cascade chains, and studios typically assign this grid architecture to games where the math model targets a volatility index (VI) of 4 to 6 on a standard 1–10 scale.
7×7 and 8×8 grids (49–64 cells): Near-universal signal of extreme volatility. The combinatorial space at 8×8 with 6–8 symbol types is sufficiently large that the engine’s max-win potential can exceed 20,000× to 50,000× stake — numbers that are mathematically impossible to achieve on a 5×3 payline grid because the base win values simply cannot compound to those levels within a single spin event. Studios do not build 8×8 grids for medium-volatility products. The infrastructure cost of modeling that grid size is only justified when the math model demands extreme variance.
The Dead-Spin Density Indicator
There is a secondary grid-derived signal that experienced players use to calibrate volatility expectations before a single spin: the per-symbol minimum cluster threshold relative to grid density.
If a 6×6 cluster engine requires a minimum cluster size of 5 symbols, the probability of that threshold being met by high-value symbols (which appear at lower weighted frequency than low-value symbols) is relatively low. But the probability of low-value symbols meeting the threshold is higher. The result is a high raw hit frequency dominated by low-value cluster wins.
Now compare: an 8×8 engine requiring a minimum cluster size of 8. The larger grid increases the spatial probability of cluster formation, but the higher minimum threshold partially offsets it. The dead-spin density — the proportion of triggered wins returning less than 0.5× stake — is a meaningful volatility indicator. Games where 55% or more of winning spins return sub-0.5× stake are, by this metric, extreme volatility products regardless of how the developer labels them.
Reading a Game’s Volatility Without Opening the Help File
The payline vs. cluster distinction is the most important architectural fact a disciplined player can internalize, because it reframes every downstream decision: session length, bankroll depth, stop-loss placement, and stake sizing.
Here is a practical framework for reading a game’s volatility profile from visual inspection alone, before you consult any documentation:
Step 1 — Identify the grid shape. Is it 5×3 or similar? Payline engine — apply paytable-based volatility assessment. Is it 6×6 or larger? Cluster engine — assume high volatility as your baseline.
Step 2 — Count the reel columns and rows. 8×8 = treat as extreme volatility until proven otherwise. Adjust your minimum session bankroll to 300–500 stake units.
Step 3 — Observe the first 20 spins. In a cluster engine, if you are winning on 40%+ of spins but your balance is declining, you are experiencing the dead-spin density effect. The engine is functioning correctly. You are in the sub-stake win region of the distribution. This is not unlucky variance — it is the expected math behavior of the architecture.
Step 4 — Track cascade depth. If you have played 100 spins without reaching cascade level 3, your session has not yet sampled the high-EV tail of the distribution. Your experienced RTP is below theoretical. This is statistically expected and does not predict future cascade depth.
Step 5 — Apply the cascade-gating principle to stake sizing. In a cluster engine with 50,000× max win potential, the correct stake is not whatever maximizes the theoretical payout. It is whatever allows you to survive enough spins to statistically sample the cascade-4 and cascade-5 event frequency. At an approximate 2% probability of reaching cascade 5, you need at minimum 50 winning spins at that depth to register one expected occurrence — and winning spins themselves occur at ~45% frequency. That implies a minimum session of ~110 total spins for a single cascade-5 exposure. At 200 spins, your expected cascade-5 exposures approach 2. Plan bankroll depth accordingly.
The payline engine and the cluster-pay engine are not two versions of the same product. They are different mathematical systems that share a surface aesthetic. Playing one as if it were the other is the most common and most expensive mistake a disciplined player can make.
RTP is where the math ends up. The engine architecture determines how you get there — and whether your bankroll survives the journey.